
Make a chart from your twitter (X) stats
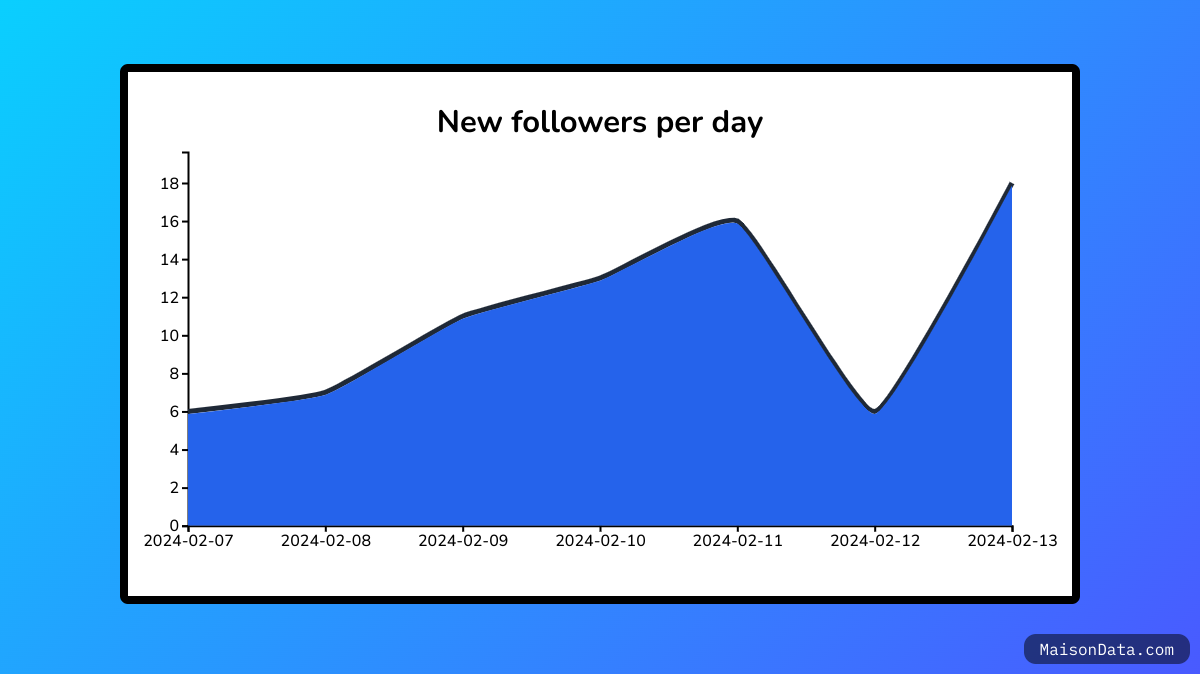
With MaisonData, you can celebrate your successes and share your setbacks through stunning charts.
An intriguing way to build your audience on Twitter (X) is by showcasing your stats to your followers. This could be the metrics from your website, your running training progress, or even your Twitter statistics.
In this article, we'll explore how to retrieve your Twitter stats, import them into MaisonData, and create a beautiful chart out of them! 🚀
Retrieve your data from X
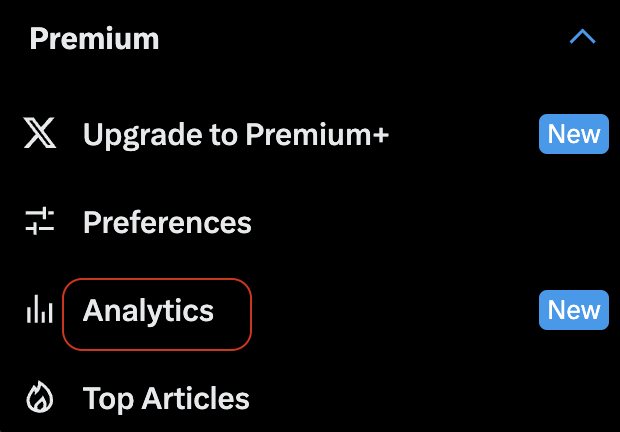
To retrieve your statistics from X, you first need to access your analytics dashboard. To do this, click on "More," located under "Profile," and then navigate to Premium>Analytics.
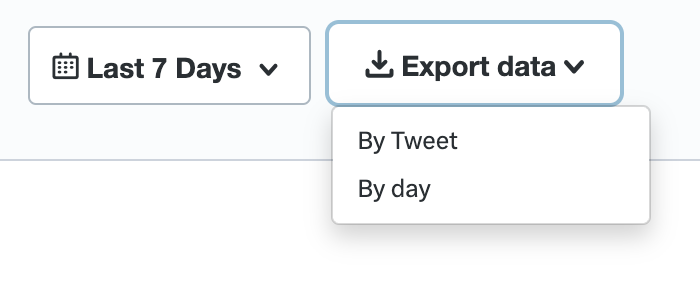
Once that's done, you can first select the time period of interest. Next, click on the "Export data" button, located at the top right of the screen. You are then presented with two options: export your data by tweet, or by day. In this example, we will export the data by day. After clicking the button, a CSV file should download. This may sometimes take a moment. 🕒
Import your data into MaisonData
Once that's done, the hardest part is over!
All that's left is to import your data, select the columns that interest you, and style your chart as you wish! Head over to MaisonData, and click on the "Import your data" button at the bottom left of the screen!
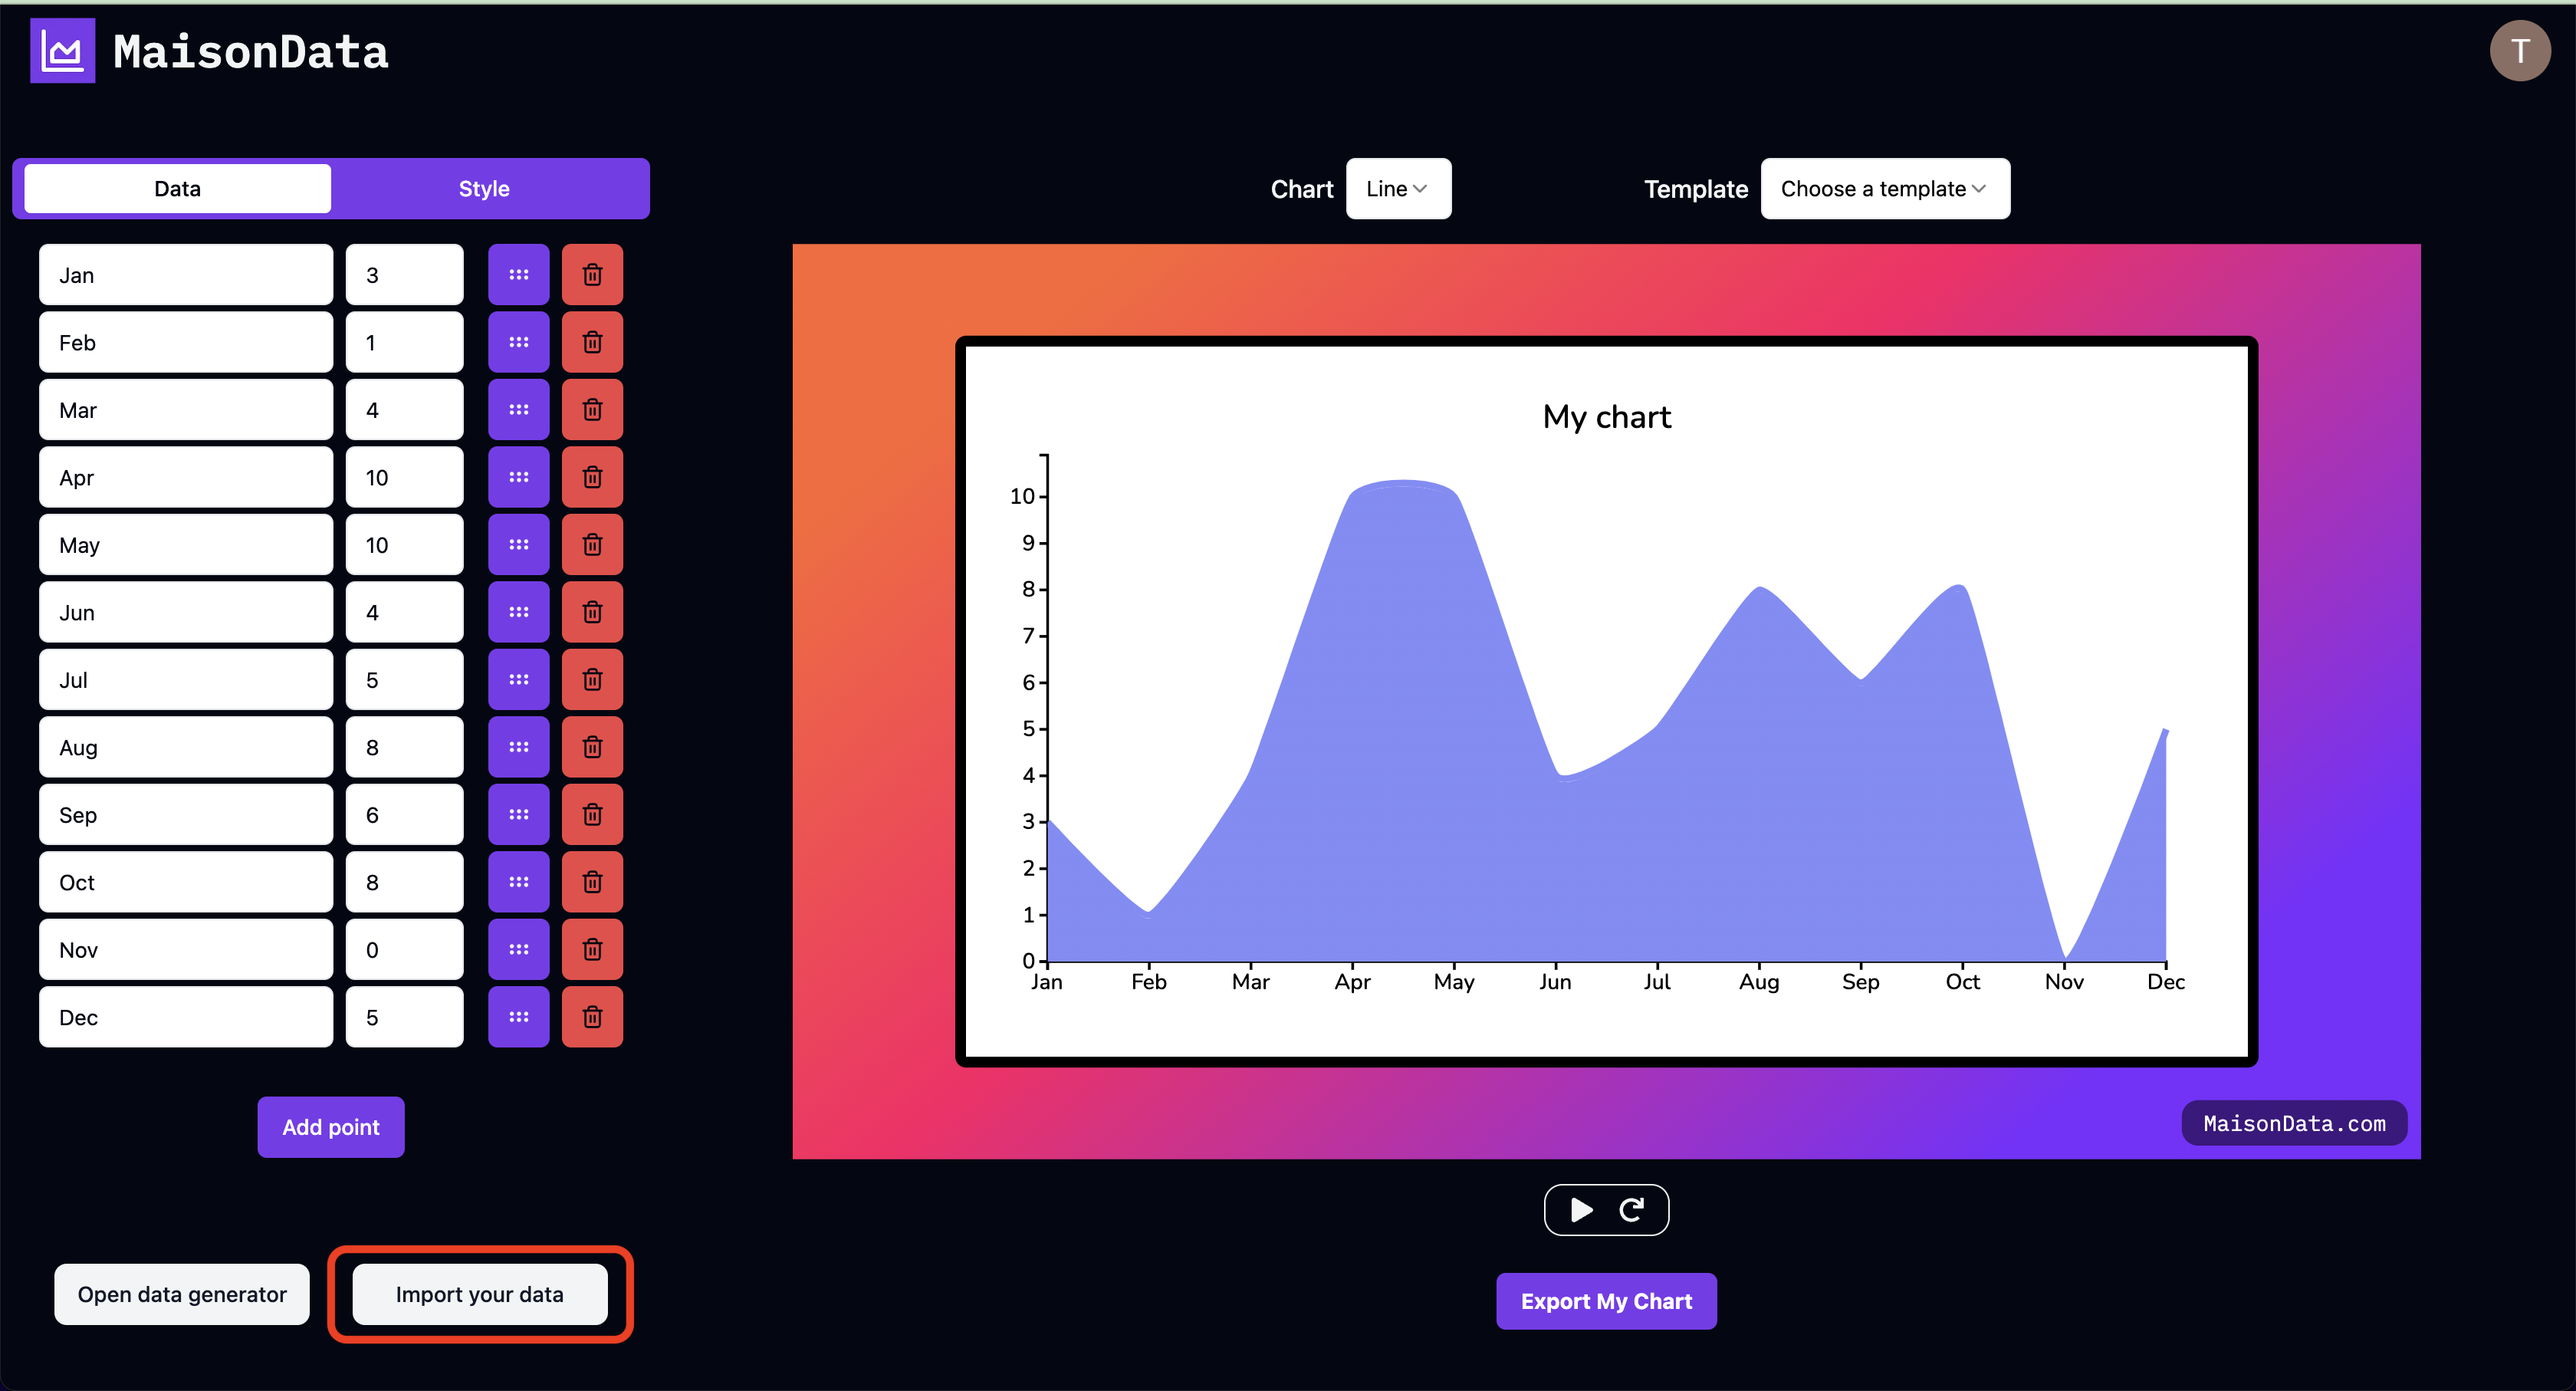
All you need to do next is to import your freshly downloaded CSV file. Given that Twitter provides a CSV using commas as a separator, don't forget to select "comma" in the "Separator" field.
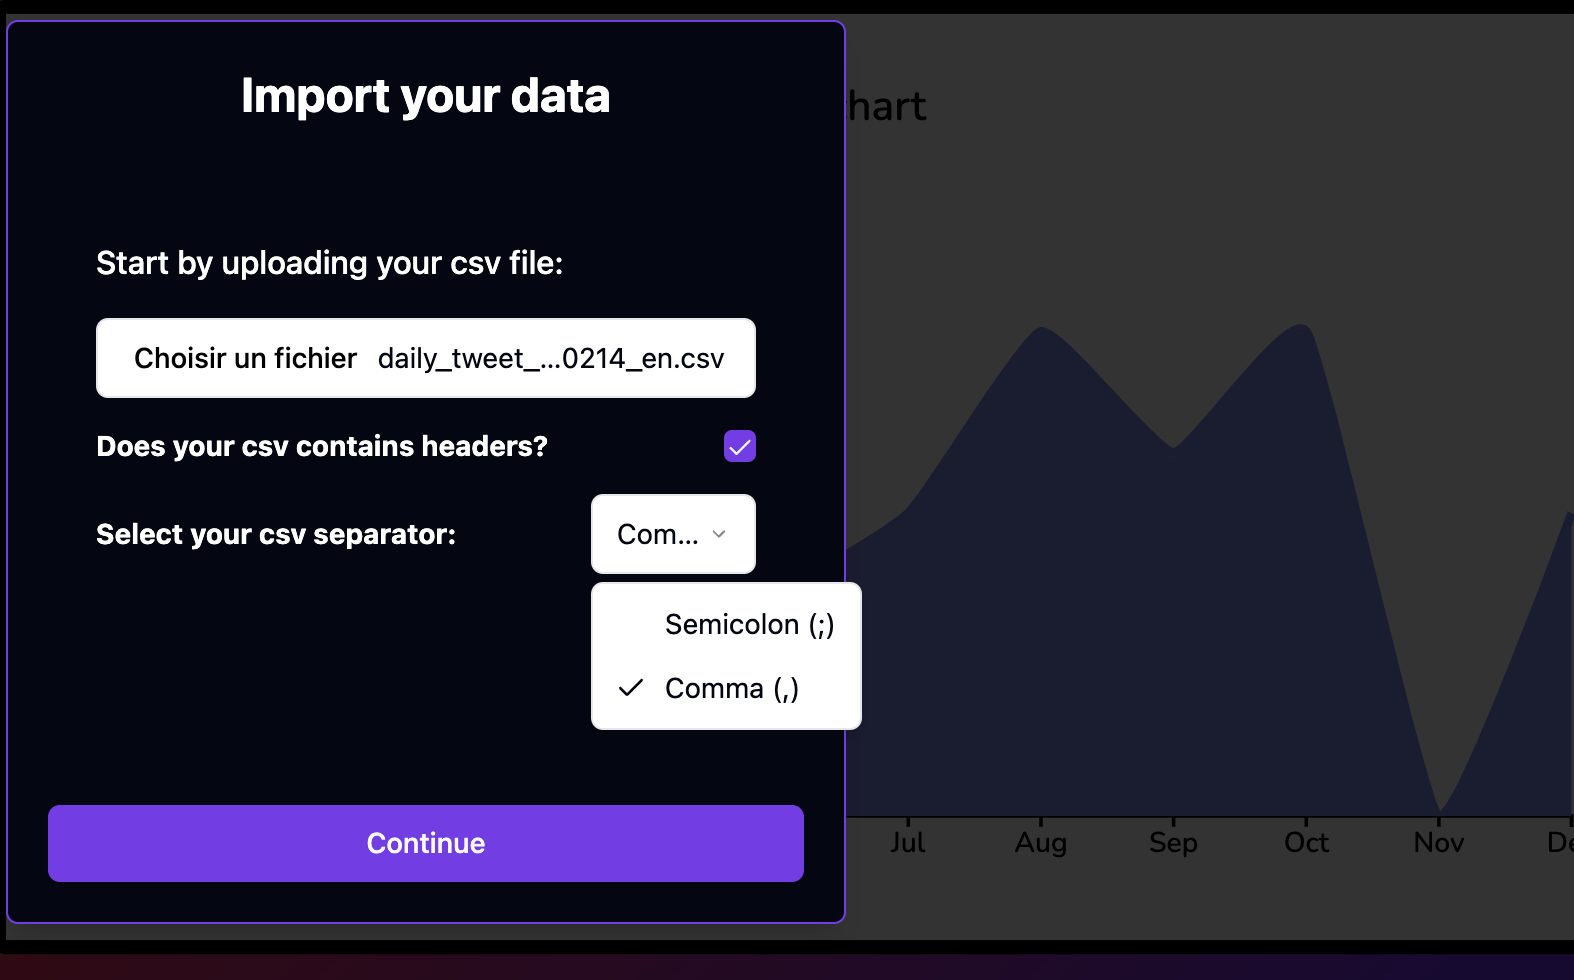
Click on "Continue" and voilà, your data is ready to be beautified and presented in the form of a stunning chart, animated or not! 🔥